Five Useful Queries to Get BigQuery Costs

At PeerDB, we are building a fast and cost-effective way to replicate data from Postgres to Data Warehouses such as BigQuery. So our customers are heavy Data Warehouse users. One topic that comes up in almost each and every engagement is Data Warehouse costs. In recent months, we've explored BigQuery costs and optimization strategies in detail. We're eager to share our learnings.
This first blog post on Five Useful Queries to Get BigQuery Costs will be helpful for any company who uses BigQuery and and wants to keep their costs in a check.
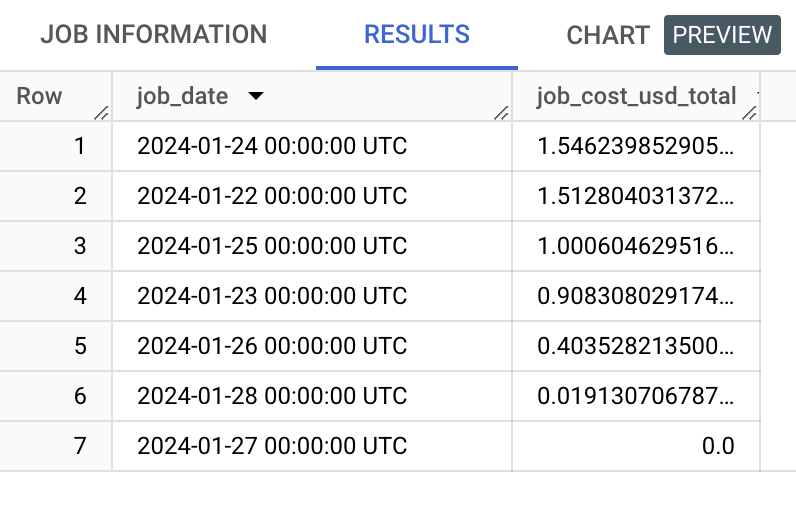
Total Cost by day in the last 7 days
Let's start by examining the overall cost estimates overtime for your BigQuery instance. This would help you understand the query load over various days, and give you a comprehensive view of the costs over each day.
SELECT
DATE_TRUNC(jobs.creation_time, DAY) AS job_date,
SUM(jobs.total_bytes_billed/1024/1024/1024/1024 * 5) AS job_cost_usd_total
FROM region-us.INFORMATION_SCHEMA.JOBS_BY_PROJECT jobs
WHERE
    jobs.creation_time >= TIMESTAMP_SUB(CURRENT_TIMESTAMP(), INTERVAL 7 DAY)
GROUP BY job_date
ORDER BY job_cost_usd_total DESC;
NOTE: Adjust the region-qualifier based on the location of your Warehouse.
Example Output:
Total Costs per Application or User
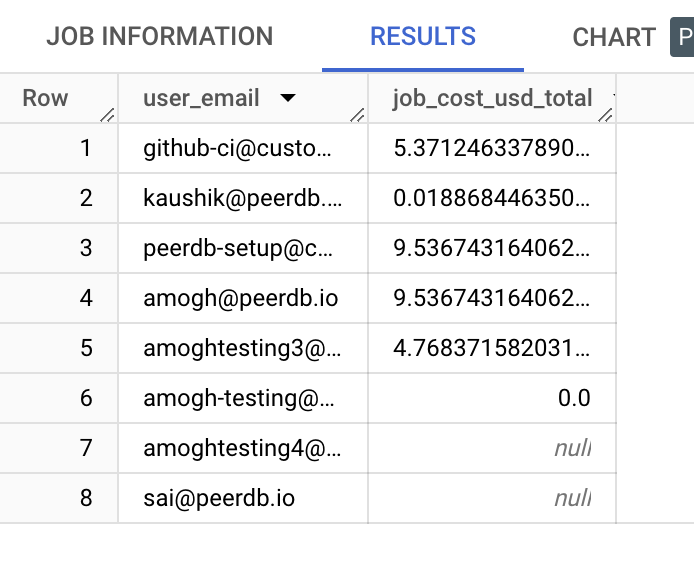
When applications query BigQuery, they usually do so using service accounts, each associated with an email. Similarly, when users in your organization access the console and run a query, it is associated with the user's email. To understand the impact of an application or a user on your BigQuery costs, the following query would be useful.
SELECT
user_email,
SUM(jobs.total_bytes_billed/1024/1024/1024/1024 * 5) AS job_cost_usd_total
FROM region-us.INFORMATION_SCHEMA.JOBS_BY_PROJECT jobs
WHERE
    jobs.creation_time >= TIMESTAMP_SUB(CURRENT_TIMESTAMP(), INTERVAL 7 DAY)
GROUP BY user_email
ORDER BY job_cost_usd_total DESC;
Example Output:
Cost Analysis Based on Query Types
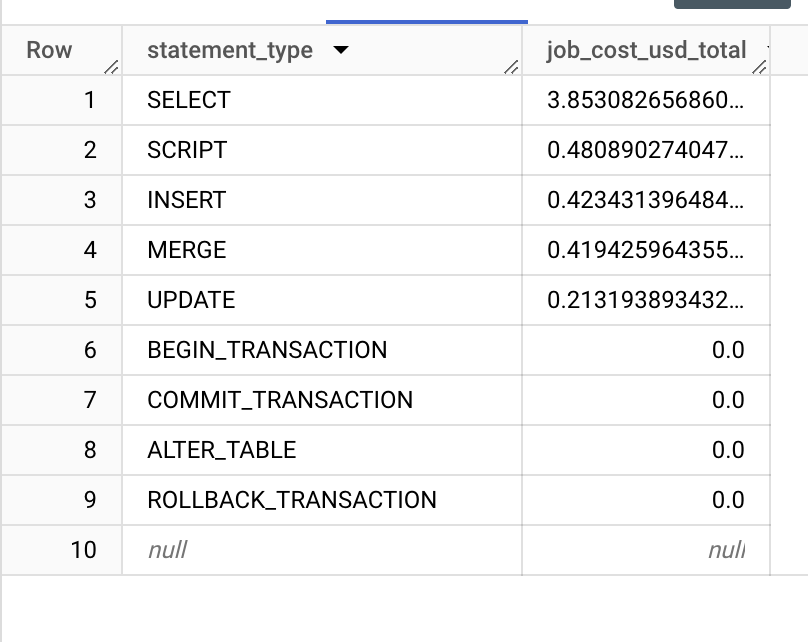
Typically, one would examine this to understand which query types are dominating costs. This is useful, for example, to determine if MERGE queries, commonly generated by transformation tools like dbt are driving up costs. This enables you to fine tune specific query types
SELECT
statement_type,
SUM(jobs.total_bytes_billed/1024/1024/1024/1024 * 5) AS job_cost_usd_total
FROM region-us.INFORMATION_SCHEMA.JOBS_BY_PROJECT jobs
WHERE
    jobs.creation_time >= TIMESTAMP_SUB(CURRENT_TIMESTAMP(), INTERVAL 7 DAY)
GROUP BY statement_type
ORDER BY job_cost_usd_total DESC;
Example Output:
Total Cost by Project in the last 7 days
You can analyze BigQuery costs per project to ensure efficient resource allocation and budget management. This analysis helps you identify high-cost projects, enabling targeted optimizations to reduce expenses.
SELECT
project_id, SUM(jobs.total_bytes_billed/1024/1024/1024/1024 * 5) AS job_cost_usd_total
FROM region-us.INFORMATION_SCHEMA.JOBS_BY_PROJECT jobs
WHERE
    jobs.creation_time >= TIMESTAMP_SUB(CURRENT_TIMESTAMP(), INTERVAL 7 DAY)
GROUP BY project_id
ORDER BY job_cost_usd_total DESC;
Query Dry Runs with no costs to get costs
In cases where you are concerned about a specific query being intensive and incurring high costs, it is useful to run the query in dry-run mode before executing it. This will show you the amount of data that the query will process, helping you estimate the costs. Additionally, you can test your data modeling optimizations – for example, clustering and partitioning – to see how they impact the amount of data processed and the costs in this way.
Run the below query using BigQuery's cli bq
bq query --format=prettyjson --dry_run \
--use_legacy_sql=false "<query_string>"
Example Output:
{
  "configuration": {
    "dryRun": true,
    "jobType": "QUERY",
    ...
    "totalBytesProcessed": "74113430156"
  },
  "status": {
    "state": "DONE"
  },
  ...
}
The above output shows that ~74GB of data would be processed by the query, and the estimated costs would be ~37 cents.
Reference: Here goes the official documentation on BigQuery costs. We found this to be a useful resource while coming with the blog.
Closing Thoughts...
Hope you enjoyed reading the blog. More blogs on BigQuery costs and optimizations are coming soon. At PeerDB, we implement mechanisms such as auto partitioning and clustering to minimize BigQuery costs while replicating data from Postgres. Few of our customers have seen 5x reduction in Warehouse costs. If you wanted give PeerDB a shot, below resources would be helpful:
Try out the our fully managed offering at no cost. OR
Visit our GitHub repository to Get Started.
Comments
Join the discussionNo comments yet. Be the first to comment.